
Rent-stabilized vacancy fell from 4.57% in 2021 to 0.98% in 2023, according to the NYC Comptroller's analysis of stabilized vacancies. That reframes NYC rental market trends: a large inventory of apartments doesn't necessarily mean a large selection of apartments you can rent. For an active search, the useful question isn't what New Yorkers pay. It's what's available for your bedroom count, location, budget, and move-in date.
Table of Contents
- Where NYC Rents Stand in 2026
- How Vacancy Fell to Its Lowest Levels
- Why Rents Keep Rising Despite New Supply
- Rent-Stabilized Apartments Versus Market-Rate Rent
- How to Check a Listing Is Truly Rent-Stabilized
- What Rental Data Can and Cannot Tell You
- Pick Your Borough and Stock Type Before You Search
Where NYC Rents Stand in 2026
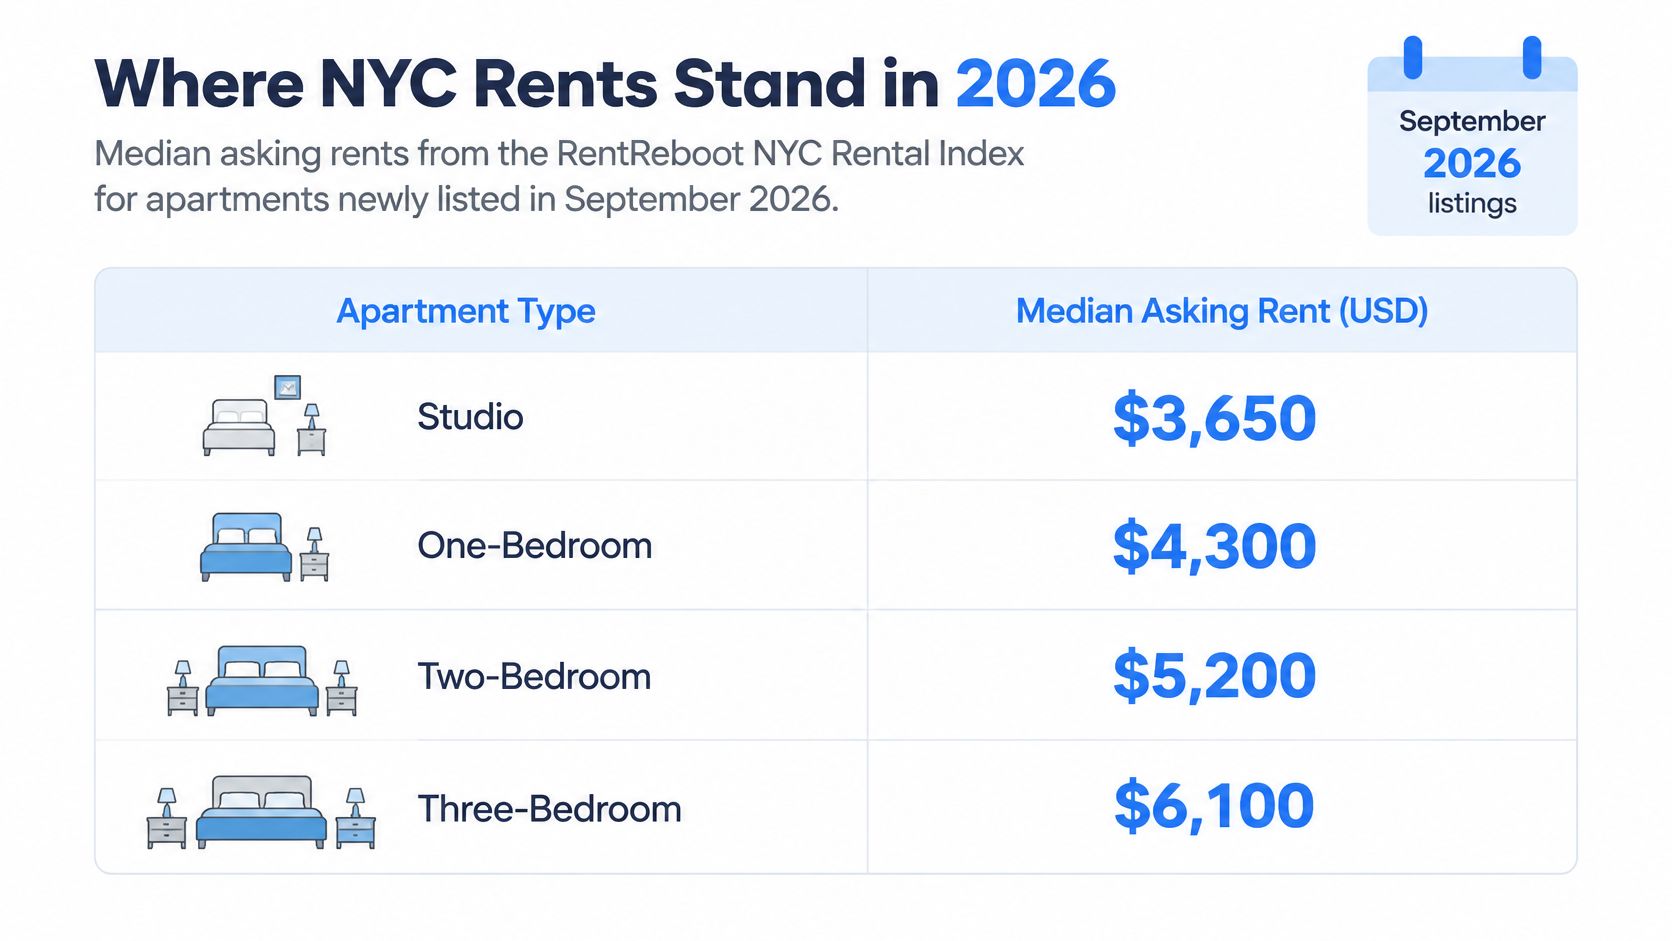
New York City's net rental vacancy rate fell to 1.41% in 2023, down from 4.54% in 2021, according to the NYC Housing and Vacancy Survey. Scarcity is the starting point for every asking-rent figure in this market, and it is the reason the citywide median is the wrong unit of analysis. A single number that blends a Bronx studio with a Manhattan two-bedroom describes no apartment a renter will tour.
Choose the comparison before the number
A median asking rent divides a defined listing sample in half: half the asking rents fall below it and half above. It doesn't describe an apartment's condition, reflect concessions, or equal the rent eventually written into a lease.
The sample itself shifts the answer. In RentReboot's summer 2026 coverage study of 50,130 NYC apartments across 20 rental platforms, matched to a single apartment by building address and unit, 51.3% of apartments appeared on exactly one platform. A median built from one marketplace therefore misses most of the market, and two indexes can disagree while both measure real listings.
Start with bedroom count, then geography, then listing period. Comparing a neighborhood's newly listed studios with a borough-wide measure covering every apartment size introduces differences that have nothing to do with whether a particular listing is fairly priced. RentReboot's free median asking-rent pages report medians for new listings by borough, size and neighborhood across 150+ NYC areas, drawn from its monthly NYC Rental Index, which makes matching your unit type and area straightforward.
For another cut at market-trend data, Zillow rental trends via RealtyAPI.io offers a sample worth examining alongside a clearly defined local measure. Check the geographic boundary, apartment category, and observation date before comparing its output with another index.
Practical rule: A rent benchmark is useful only when you can say which apartments it includes.
How Vacancy Fell to Its Lowest Levels
Citywide net rental vacancy fell from 4.54% in 2021 to 1.41% in 2023, according to the NYC Housing and Vacancy Survey's selected initial findings. The tightening was steepest at the lowest rents.
Vacancy and availability by rent level, 2023
| Measure | 2023 |
|---|---|
| Citywide net rental vacancy | 1.41% |
| Vacancy among units renting below $1,100 | 0.39% |
| Vacancy among units renting below $2,400 | Below 1% |
| Rental units available for rent, survey count | 33,210 |
The survey counted 33,210 apartments available for rent out of approximately 2.357 million occupied and vacant rental units. Two different quantities sit inside that ratio: the rental stock and the available rental stock. Most rental apartments are already someone's home, and an occupied unit gives a household trying to move no option at all.
The 2021 baseline explains part of the swing. Residents leaving the city, postponed moves, and slower household formation had produced unusually loose conditions. When demand returned, renters met a far smaller pool of available homes, and the rate dropped to a fraction of its earlier level.
The affordable segment was tighter than the headline
The citywide rate averages apartments at very different prices. For a renter on a constrained budget, a vacant expensive unit cannot replace an occupied affordable one, so the aggregate figure overstates the choices available to that household. The 2023 breakdown shows the gap directly: 1.41% vacancy overall, 0.39% among units renting below $1,100, and under 1% below $2,400.
Affordability is a question of price and access together. An apartment priced well below the surrounding market still does nothing for a search while it remains occupied, and a listing that exists on only one site does nothing for a renter who never sees it. In RentReboot's summer 2026 coverage study, 51.3% of NYC apartments appeared on exactly one of 20 tracked platforms, so any single website shows a slice of the available market.
That fragmentation and scarcity carry practical consequences:
- A narrow budget requires broader discovery. Search across appropriate neighborhoods and multiple listing sources, since each platform carries inventory the others miss.
- A promising listing needs an availability check. Ask whether showings are being scheduled, whether an application is already pending, and when possession is possible.
- A fast response requires preparation. Keep application documents organized before arranging viewings, while continuing to verify the apartment and the person offering it.
Scarcity changes the order of work
Negotiation becomes relevant only after a renter finds an apartment that fits. When the binding constraint is locating a viable opening, tracking a headline rent forecast produces no additional choices.
Prepare your documents, define the features a listing must have, and learn to separate newly published listings from reposts of unavailable units. Then weigh the asking price against comparable apartments. Discovery comes before negotiation, and speed pays off only alongside verification.
Why Rents Keep Rising Despite New Supply
New construction doesn't automatically produce a larger pool of apartments waiting for tenants. Nearly 19,000 newly constructed rental units entered the market in 2025, a 37% increase from 2024, yet available rental inventory declined, according to the NYC Comptroller's March economic and fiscal outlook. That outlook also reports citywide rent increases of nearly 6% year over year in January–February 2026, with stronger increases in Manhattan and more moderate growth in Queens.
The construction-versus-availability contrast is illustrated below.
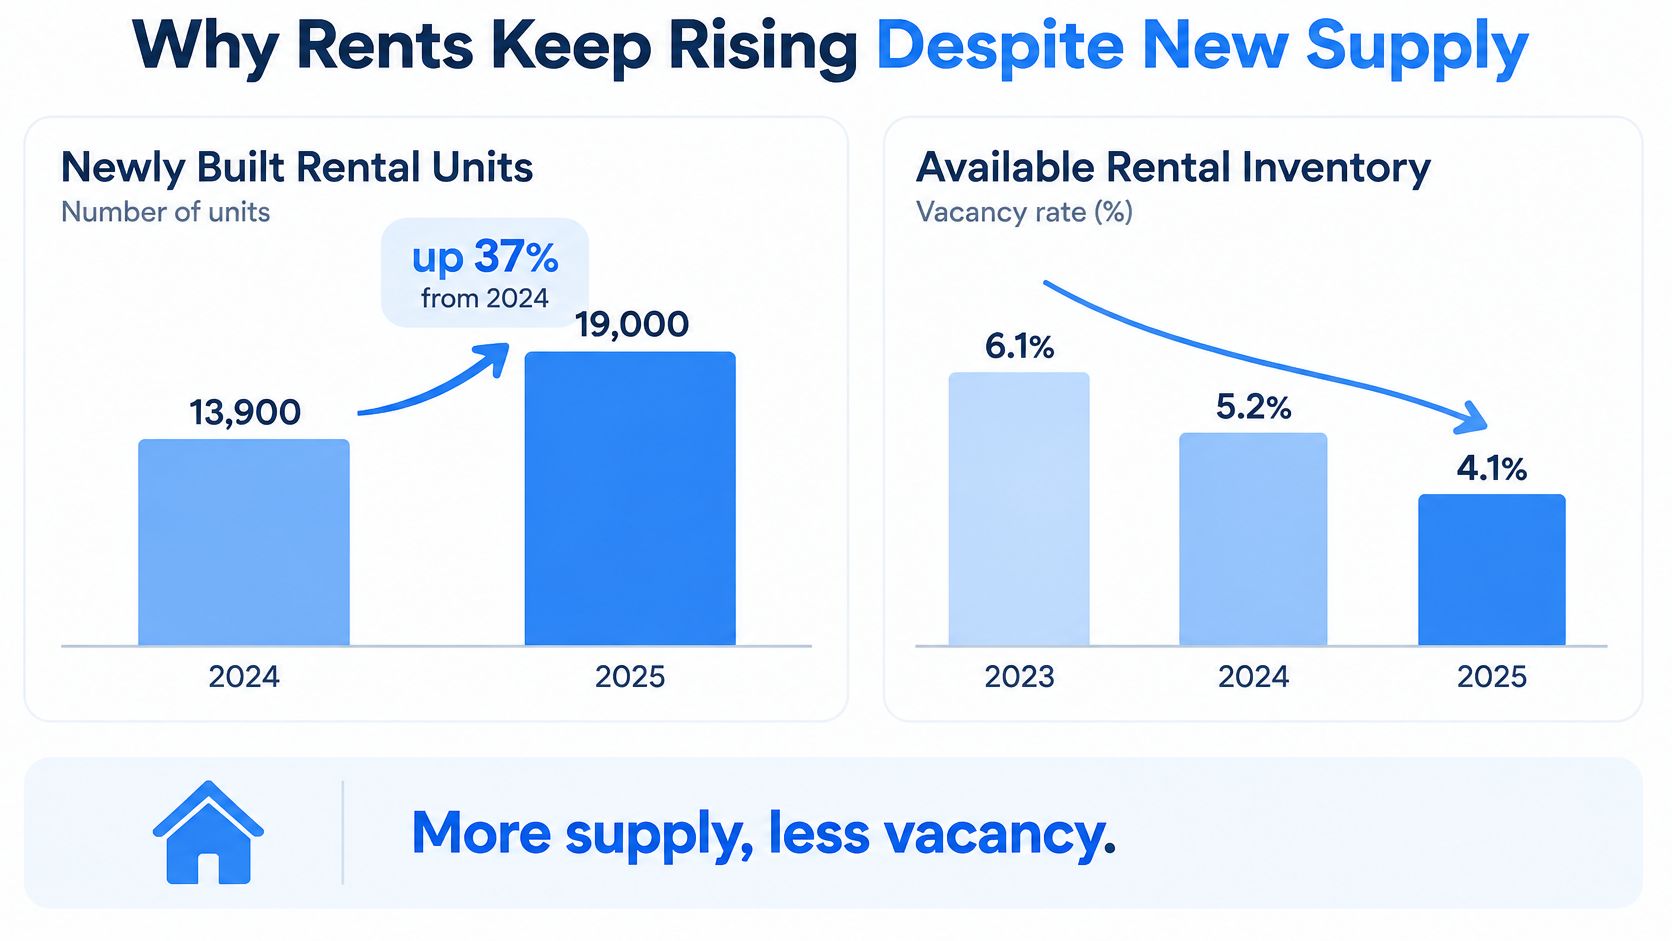
New supply is a flow; available inventory is a snapshot. Builders can deliver apartments while renters lease them quickly enough that the number still available falls. That result doesn't establish that construction has no effect on rents. It establishes that construction totals alone can't tell a renter how many suitable apartments remain open.
Building type and turnover change the comparison
Our listing-history analysis finds that apartments returning to market within a year raise their asking rents by a median of under 1% per year across cycles. Apartments that hold tenants for three years or longer raise their asking rents by roughly 3% per year. These are observed asking-rent patterns, not promises about an individual renewal or a record of what every tenant paid.
The distinction matters when interpreting a newly listed apartment. A price change following a lengthy absence from the market covers a different period from a change between frequent listings. Comparing the percentage changes without accounting for elapsed time can exaggerate the apparent difference.
Use building age as another comparison category, not a shortcut to value. A comparison of prewar and newer-building rents is most useful when geography is held constant. Otherwise, location differences can be mistaken for a building-age premium.
Search where the actual openings are
Keep commute requirements fixed while testing different neighborhoods and building types. Compare the stated monthly rent, concessions, lease term, and apartment features rather than assuming a new building must cost more or an older building must be cheaper.
For additional viewing, the following video accompanies the supply discussion.
The actionable conclusion is narrower than a rent forecast: track available apartments in the segment you can rent, not just buildings completed across the city.
Rent-Stabilized Apartments Versus Market-Rate Rent
Rent-stabilized and market-rate apartments compared
| Measure | Rent-stabilized | Market-rate |
|---|---|---|
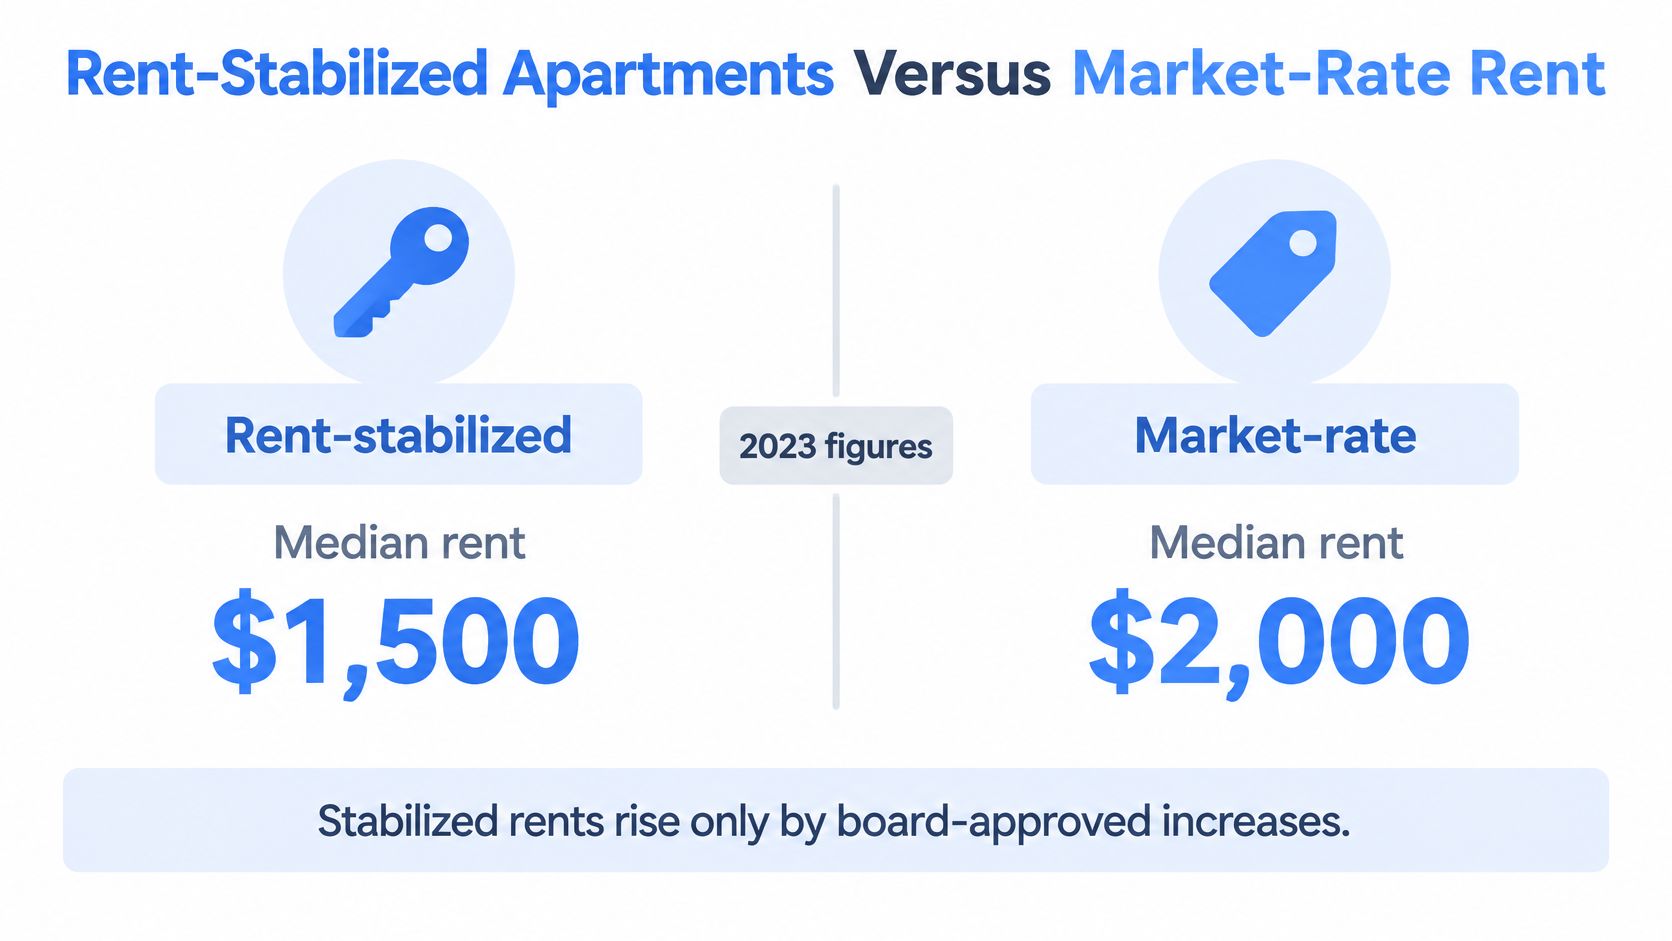
| Median rent, 2023 | $1,500 | $2,000 |
| Net vacancy rate, 2023 | 0.98% | 1.84% |
| Nominal rent growth, 2021 to 2023 | 7% | 10% |
The NYC housing department's testimony to the Rent Guidelines Board reports the table's 2023 median rents and vacancy rates, alongside 2021-to-2023 nominal rent growth for stabilized and market-rate apartments. Its official analysis also describes roughly one million stabilized apartments, representing about 41% of rental apartments and 27% of all housing units citywide.
The visual highlights the rent comparison, rather than the probability of finding an available apartment.
A substantial stock can produce few openings
The regulated sector is large, but its size doesn't establish turnover. A renter needs an apartment that is both suitable and available, not just an address inside a large housing category.
The table also describes different groups of apartments. The difference between group medians isn't a guaranteed discount on an otherwise identical home. Location, apartment size, condition, and which units remain occupied can all affect the comparison a renter needs to make.
A borough-level stabilized-versus-market comparison can help frame a more relevant question: what does the regulated segment look like where you're willing to live? It still can't establish the legal status or value of an individual advertised apartment.
Treat a stabilized apartment as a possible search outcome, not the assumption that makes your budget work.
Separate housing estimates from legal evidence
Our tenancy figures are estimates inferred from market behavior, not lease records. An apparent gap between listing dates can inform an analysis of turnover, but it doesn't prove who occupied the apartment, what they paid, or what lease rights applied.
That limitation shouldn't be confused with the official housing-stock estimates. Different datasets answer different questions, and their methods shouldn't be blended.
For rent regulation, we defer to New York State Homes and Community Renewal, the agency that administers the rule. A platform label or market-history inference isn't a substitute for documentation from the relevant regulatory process.
Keep both regulated and market-rate options in your search unless your circumstances require otherwise. Compare immediate affordability, documented lease terms, and move-in feasibility separately. A lower advertised rent is valuable only when the apartment is real, available, and offered on terms you understand.
How to Check a Listing Is Truly Rent-Stabilized
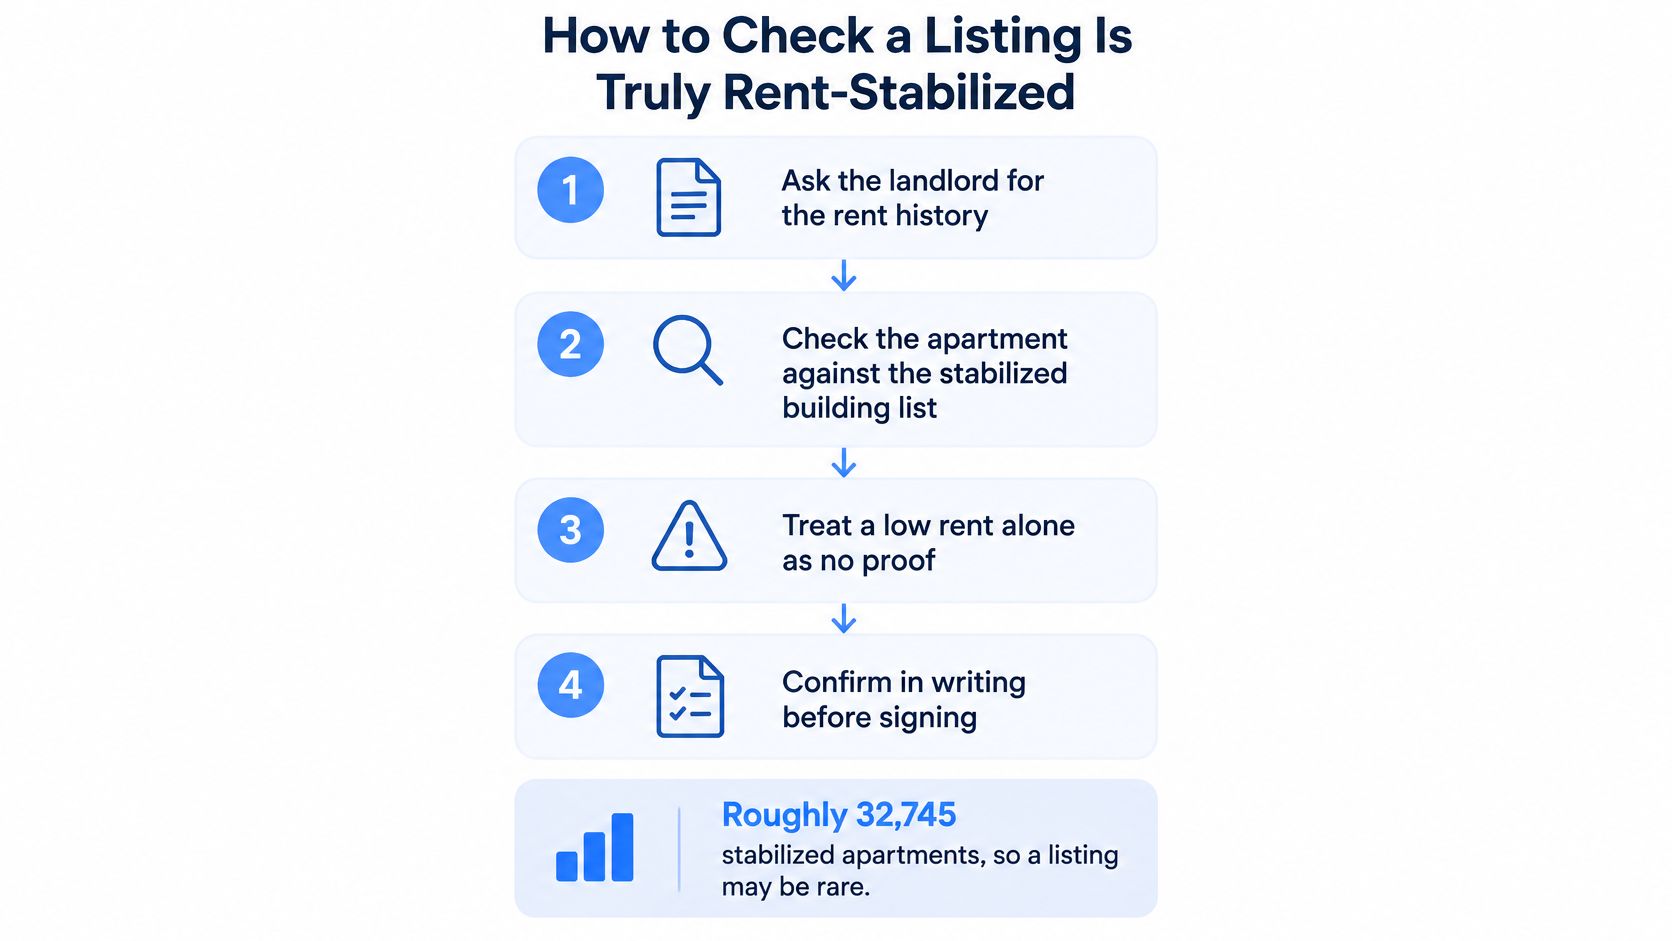
A low asking rent is a reason to investigate, not proof of regulation. Approximately 32,745 apartments entered stabilization in 2025, while at least 11,464 left, and the median legal rent for newly registered apartments was $2,146, according to the city-published stabilization report. Entries into a regulatory system aren't the same as apartments currently advertised for rent.
The visual summarizes verification prompts. Its entry-count annotation shouldn't be read as the total stabilized stock or the number of available listings.
Follow the apartment, not just the building
Compare the asking rent with relevant listings. Use the same neighborhood and bedroom count, and inspect differences in condition, floor, and lease terms. An unusually low price is a screening lead, not a legal test.
Read the listing's exact description. Rent-stabilized, income-restricted, and informally described as affordable aren't interchangeable claims. Save the advertisement and ask which specific apartment the statement covers.
Look up the address in official stabilization records. Match the building address carefully, including alternate entrances or address formats. A building-level match is a reason to investigate the unit, not permission to assume every apartment has identical status.
Ask the landlord or broker for documentation supporting the apartment's status, current legal rent, and registration history. Request clarification before paying an application fee, and distinguish documents an owner supplies from records you may need to request through the agency. Don't substitute a verbal assurance for a consistent written explanation.
Resolve conflicting information with New York State Homes and Community Renewal. Bring the precise unit designation, listing, and available paperwork rather than asking only whether the building is stabilized. If a document isn't accessible to you as a prospective tenant, identify what remains unverified instead of treating the absence as confirmation.
Confirm that the apartment is ready to rent. Ask about required work, access for viewing, and the expected possession date. A regulatory record establishes neither current availability nor move-in readiness.
Distinguish the claim from the evidence
Keep a short evidence file containing the advertisement, apartment designation, written answers, and documents received. If those materials disagree, pause the financial decision until the discrepancy is explained.
An informal affordability claim describes a price. A legally regulated status concerns the apartment's applicable rules and documentation. You need to know which claim the person offering the apartment is making.
What Rental Data Can and Cannot Tell You
An asking rent isn't a signed rent. A listing feed isn't a census. A citywide median isn't a neighborhood budget. These distinctions determine whether a housing statistic helps you choose an apartment or merely describes a different population.
Where the NYC rental figures come from
| Source | What it measures | Main limit |
|---|---|---|
| NYC Housing and Vacancy Survey | Vacancy, median rent, and stock by segment | A survey-period snapshot, not a live listing feed |
| Monthly rental listing index | Asking rents of apartments first listed each month, by borough and size | Covers observed listings; sample rules must be documented |
| Platform listing data | Apartments advertised across rental sites | Coverage and publication timing differ |
| Stabilization records | Regulatory registrations and legal-rent information | Require unit-level interpretation and agency verification |
Our coverage study found that 51.3% of NYC apartments appeared on exactly one of 20 tracked platforms. Observed listings aren't a census of every privately marketed or off-market apartment. That means a thorough-looking search result can still omit apartments outside the platforms observed.
The rental-platform coverage report addresses a different question from a rent index: where apartments appear. Price comparisons and discovery coverage need separate evaluation.
Missing information changes the conclusion
A listing records what someone advertises, not necessarily the final agreement. Unless a dataset includes signed leases, don't use it to claim what tenants ultimately accepted.
Likewise, an apartment's first observed appearance is not necessarily its first publication anywhere. A monitoring system records what it detects within its coverage, which is why publication timing needs a defined observation method.
Reading test: Before using a statistic, finish the sentence, “This number describes these apartments during this period.”
Finally, changes in a median can reflect changes in the mix of listings, not just repricing of comparable apartments. If the observed sample contains more expensive apartment types, its median can rise without proving that every comparable unit became more expensive.
Compare the same geography, bedroom count, stock category, and listing period whenever possible. When those dimensions don't match, describe the comparison as directional rather than precise.
Pick Your Borough and Stock Type Before You Search
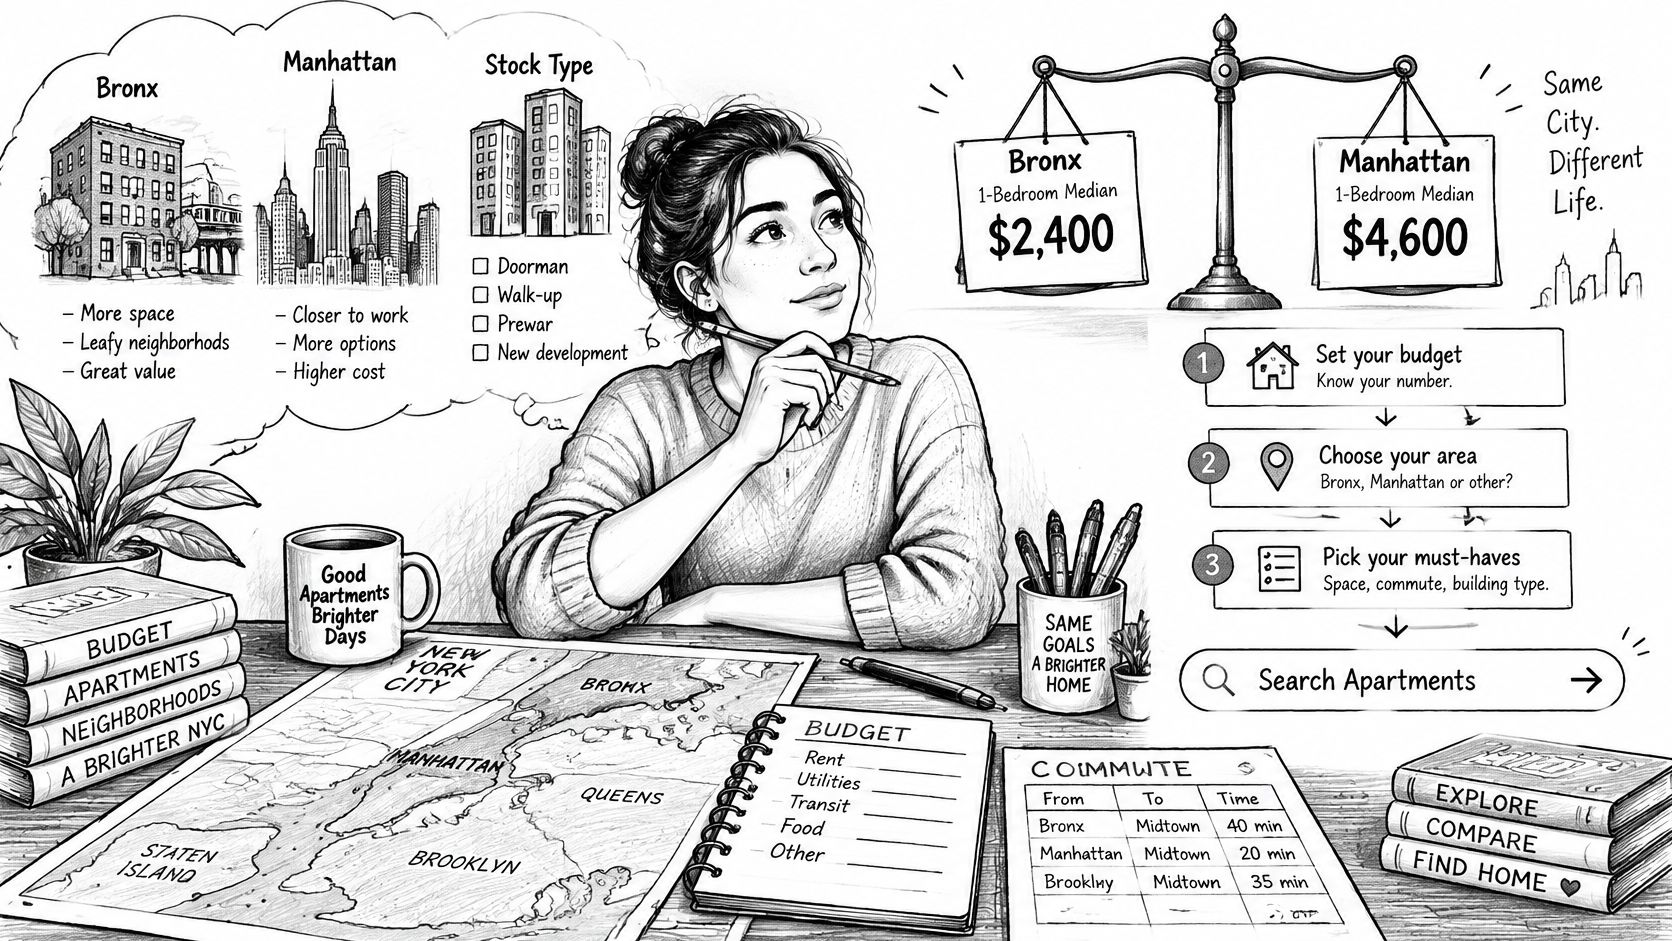
Start with the choices you control: where you can live, which lease terms you'll accept, and how you'll evaluate an opening. Don't let an undifferentiated citywide price decide those questions for you.
Set constraints before collecting listings
Choose geography through the commute. Identify workable transit routes and test the trip at the times you'll travel. Then compare apartments within that feasible area rather than choosing a borough solely because its aggregate rent looks lower.
Choose stock type through your requirements. Decide whether you need an immediately available apartment or can tolerate a longer verification process for a potentially regulated option. Don't assume either category guarantees a quick signing, predictable condition, or a particular saving.
Choose a response process before an alert arrives. Save your search criteria, organize documents, and prepare questions about availability and lease terms. Respond promptly to suitable listings without allowing urgency to override checks.
Make the budget sustainable
Your maximum rent should come from your household budget, not from a market median plus an arbitrary margin. Use comparable asking rents to test whether your requirements are realistic, then adjust location, size, amenities, or timing where possible.
For neighborhood comparisons, our free median asking-rent pages cover 150+ NYC areas, segmented by location and apartment size. This week, build a shortlist of feasible neighborhoods, compare the appropriate apartment category, and write down your firm spending limit before scheduling viewings.
Visit RentReboot to compare neighborhood asking rents and set alerts for apartments matching your budget, location, and bedroom count. Use the free rent-stabilized buildings map to investigate promising addresses, then verify the specific apartment's status before making a financial commitment.